


(And How to Track Them)
Open an economic calendar on any given week and you’ll see 40 or more releases. Most of them are noise. A handful genuinely move currency pairs, and a smaller handful again move them for more than an hour.
Most retail FX traders struggle with fundamental analysis not because the concepts are hard, but because nobody gives them a filter. They treat a Swiss trade balance print with the same seriousness as a US CPI release, get whipsawed, and conclude that fundamentals “don’t work” for short-term trading.
Traders who read macro correctly aren’t smarter. They’ve learned which economic indicators matter, why they matter, and how each one connects to interest rate expectations and positioning. That’s a filter you can build once and apply forever.
This guide covers the indicators worth tracking, what each one tells you about currency valuation, and how to turn them into a repeatable weekly process instead of a reactive scramble every time a release hits the wires.
The One Rule That Governs Everything Below
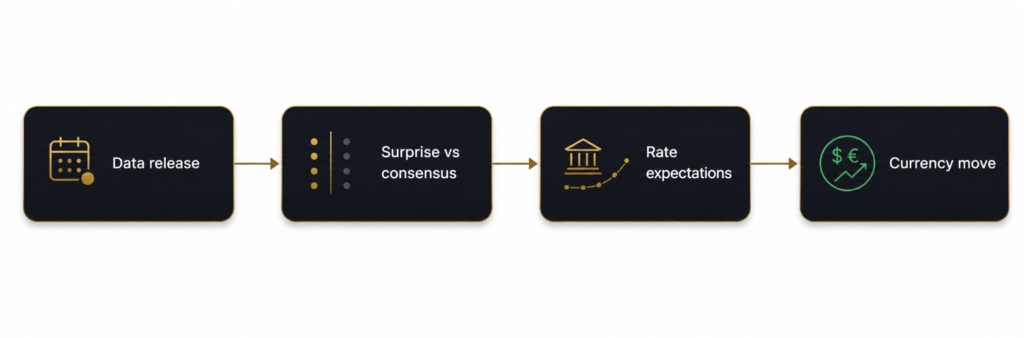
Data doesn’t move currencies. Surprises relative to expectations, filtered through what that surprise implies for interest rate policy, move currencies.
Read that twice, because almost every fundamental analysis mistake traces back to ignoring it.
A “strong” jobs report is meaningless in isolation. Its significance depends on three things:
- What the market expected. A 200k payrolls print against a 150k consensus is a positive surprise. The same 200k print against a 250k consensus is a negative surprise. The absolute number is the least interesting part.
- Where the central bank sits in its cycle. Strong labor data during a cutting cycle delays cuts, which is currency-positive. The same data mid-tightening cycle may just confirm what’s already priced.
- What the rest of the data is doing. One hot inflation print inside a clear disinflationary trend gets faded. The third consecutive hot print reprices the curve.
Everything below should be read through that lens: does this change the expected path of interest rates, relative to what was already priced?
The Core Economic Indicators for FX Traders
1. Inflation (CPI, PCE, HICP)
Inflation data is the single biggest input into central bank rate decisions, which makes it the single biggest input into currency valuation.
A hotter-than-expected print raises the odds of tighter policy or delays expected cuts, which tends to support the currency. A cooler print does the opposite.
What to actually watch:
- Core over headline.
Core strips out food and energy and is what most central banks target in practice. When headline and core diverge, the market usually trades core. - Services inflation and shelter/rents.
These are the sticky components. Goods disinflation is easy; services disinflation is what central banks are waiting on. - Month-on-month, not just year-on-year.
Annual figures carry base effects from a year ago. The monthly run rate tells you what’s happening now. - Which measure the bank targets.
The Fed watches core PCE, not CPI. The ECB watches HICP. The RBNZ and RBA watch trimmed mean measures. Trading the wrong gauge is a common error.
Typical impact: High. Often the largest single-release move of the month for majors.
2. Employment and Labor Market Data
Labor market strength feeds directly into central bank reaction functions, particularly in dual-mandate economies like the US where employment sits alongside price stability in the mandate.
What to actually watch:
- Wage growth above all.
Average hourly earnings, the Employment Cost Index, and equivalent measures are forward indicators of services inflation. A labor market running hot on wages can keep a bank hawkish even as other data softens. - The unemployment rate trend, not the level.
Rate-of-change matters. Rules of thumb around rising unemployment triggering recession dynamics get significant market attention. - Revisions.
Prior-month revisions to payrolls routinely swamp the headline surprise. Markets read the revised trend, not the single print. - Participation rate.
A falling unemployment rate driven by people leaving the workforce is a different signal than one driven by hiring.
Typical impact: High, especially US non-farm payrolls.
3. Central Bank Rate Decisions and Forward Guidance
This is the indicator every other indicator feeds into. It’s also the one traders most consistently misread, because they focus on the decision instead of the language.
The rate decision itself is usually priced in with high confidence before the meeting. The move comes from:
- The statement’s changed wording.
Compare it line by line against the previous statement. A removed sentence about “further tightening” is a policy signal. - The press conference.
Tone and emphasis frequently reverse the initial statement reaction. - Updated projections.
The Fed’s dot plot, the ECB and BoE staff forecasts, the RBNZ’s OCR track. A shifted projected rate path repriced against market pricing is a clean, tradeable signal. - Vote splits.
A 5-4 hold means something very different than a unanimous one.
This is why currencies can move sharply on a “no change” decision. Nothing changed in the rate, and everything changed in the expected path.
Typical impact: High to very high.
4. PMI and Business Sentiment Surveys
Purchasing Managers’ Index data arrives faster than GDP and tends to lead it, making it a useful early-warning indicator for growth momentum. Flash PMIs in particular land weeks ahead of hard data.
What to actually watch:
- The 50 line.
Above 50 signals expansion, below 50 signals contraction – but the direction of travel and distance from 50 both matter more than a single crossing. - The prices-paid and prices-received sub-indices.
These are early inflation signals and often the part of the release that moves rate expectations. - Services versus manufacturing.
In most developed economies, services is the larger share of GDP. A weak manufacturing PMI alongside a solid services PMI is a very different picture than both rolling over. - Sentiment gaps.
Survey data can diverge from hard data for extended periods. When it does, hard data usually wins eventually, but the survey moves prices first.
Typical impact: Medium to high, particularly flash releases.
5. GDP and Growth Data
Growth data is backward-looking and slower-moving than inflation or employment, so any single print rarely produces a large move. It matters as backdrop.
Diverging growth trajectories between two economies – one accelerating, one stalling – show up in relative currency strength over the medium term. This is the growth differential, and it’s a key input into medium-horizon directional views even when the day-of reaction is muted.
Typical impact: Low to medium on the day, high as context.
6. Retail Sales and Consumer Confidence
These read the demand side of the economy, and retail sales in particular is a timely read on consumer spending strength. For consumption-driven economies like the US, that’s a large share of GDP arriving with far less lag than GDP itself.
Watch the control group or core measure, which strips out volatile categories like autos and gasoline and feeds more directly into GDP calculations.
Typical impact: Medium.
7. Trade Balance and Current Account
Persistent trade surpluses or deficits shape structural currency demand over time. This matters far less for day-to-day moves and far more for understanding a currency’s medium-term fair value and its vulnerability to shifts in capital flows.
Commodity-linked currencies deserve particular attention here – terms of trade shifts flow through the trade balance and into the currency over quarters, not days.
Typical impact: Low on the day, high for structural context.
8. The Indicator That Isn’t a Data Release: Rate Differentials
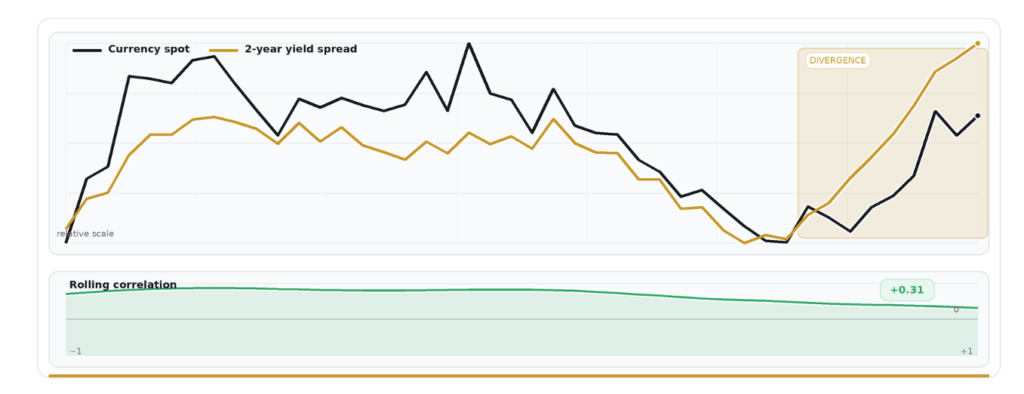
Not on any economic calendar, but arguably the most useful screen in FX: the 2-year government bond yield spread between two economies.
Two-year yields capture the market’s expected policy path over the medium term. The spread between two countries’ 2-year yields is a compact expression of the relative rate expectations that drive the currency pair. When spot price diverges from the spread, you’ve found either a mispricing or a signal that something other than rates is driving the pair – flows, risk sentiment, or intervention.
Tracking spot against the 2-year spread, and the rolling correlation between them, is one of the highest-value habits an FX trader can build.
What “Priced In” Means, and How to Check It
You can’t trade a surprise if you don’t know what was expected. Before any major release, you want two numbers:
- Consensus expectation – the median economist forecast, published on any economic calendar.
- Market-implied pricing – for central bank decisions, overnight index swap (OIS) rates tell you the probability the market assigns to each outcome. If OIS prices an 85% chance of a hold, a hold is a non-event and a cut is a large move.
The gap between those two is where the trade lives. A release that comes in exactly at consensus can still move the currency if positioning was leaning one way.
Turning Indicators Into a Repeatable System
Tracking indicators one at a time as they hit the calendar is reactive, and reactive traders are always a step behind the repricing. A repeatable process looks more like this.
1. Build a standing view of each economy’s cycle position.
For each currency you trade: is inflation rising or falling? Is the labor market tightening or loosening? Is growth accelerating or decelerating? Is the central bank hawkish, neutral, or dovish, and what has it said most recently? This context determines how much any single data point should shift your view.
2. Track relative, not absolute.
A currency pair moves on the differential between two economies. Always ask “compared to what’s happening in the other currency.” A weak US print with an even weaker European print is not a EURUSD short.
3. Know what’s priced before the release, not after.
Consensus and market-implied pricing, checked the day before. Not while the number is printing.
4. Prioritize ruthlessly.
If you have limited time: inflation, employment, and central bank commentary. These three drive the large majority of medium-term FX direction. Everything else is confirmation.
5. Revisit on a fixed cadence.
Weekly, not “when something dramatic happens.” A scheduled review of where each major economy sits in its cycle keeps you ahead of consensus shifts instead of reading about them after the market has repriced.
6. Write your view down before the week starts.
A one-line bias per pair, with the condition that would invalidate it. This is the difference between a framework and a feeling.
The Honest Problem With Doing This Alone
The challenge with this approach isn’t understanding the indicators. Everything above is learnable in an afternoon.
The challenge is the time cost of doing it consistently across ten economies, week after week: pulling the data, cross-referencing consensus, checking what’s priced into the curve, tracking yield spreads against spot, and connecting all of it to a coherent bias – before the trading week starts and while holding down whatever else your life involves.
Professional desks solve this with terminal access and dedicated analysts. Most independent traders have neither. That’s not a knowledge gap, it’s an infrastructure gap, and it’s the specific gap The Venca Report is built to close.
That’s Where TVR Comes In
Our paying members get;
- A live macro dashboard
Built to be left open all day: what’s happened, what’s happening, and what’s coming. - 2-year yields and cross-country spreads
Plotted against spot with rolling spread-to-spot correlation, so you can see when a pair has decoupled from its rate driver. - A curated G10 economic calendar
Covering today and the week ahead, filtered to the releases that actually matter rather than all 40. - Cross-economy comparison tables
For inflation and rate differentials, so the relative picture is one glance instead of ten browser tabs. - Price-moving FX headlines
Surfaced as they land, without the noise of a general news feed. - Written macro commentary
Connecting the data to rate expectations, positioning, and what it means for specific pairs. - A position size calculator
And trading tools built into the same workspace.
The Venca Report publication, and all the members-only tools and resources are built by an ex-institutional trader, with the goal of bringing that same institutional-grade data and insights to everyday traders – all at an affordable price.
If you’re still unsure if this service is for you, and you’d rather build the knowledge first, then sign up to our free mailing list to receive market insights and communications. You can sign up here:
Frequently Asked Questions
Which economic indicator has the biggest impact on forex?
Inflation data (CPI, PCE, or the local equivalent) generally has the largest and most durable impact, because it’s the primary input into central bank rate decisions. US non-farm payrolls and central bank meetings produce comparable or larger single-day moves.
Do fundamentals matter for short-term forex trading?
Yes, but differently than for position trading. Intraday, fundamentals mainly determine which direction has support and where volatility clusters. A short-term trader who knows CPI lands at 8:30am and what’s priced into it has a meaningful edge over one who doesn’t.
How far in advance should I check the economic calendar?
At minimum, review the week ahead before Monday’s open, then confirm the day ahead each morning. Knowing a high-impact release is coming is often more valuable than predicting the number.
Why did the currency fall on good economic data?
Almost always one of three reasons: the data missed consensus even though it looked good in absolute terms, the market had already priced an even better outcome, or a different component of the release (revisions, sub-indices, wage data) contradicted the headline.
What does “priced in” mean in forex?
It means the market has already adjusted prices to reflect an expected outcome. If a rate cut is fully priced, the currency has already moved for it, and the cut itself produces little reaction. Only deviations from what’s priced generate moves.
The Bottom Line
Good fundamental FX analysis isn’t about tracking everything. It’s about knowing which handful of indicators actually drive rate expectations, reading them relative to what the market already expects, and comparing economies against each other rather than in isolation.
Build that filter once and apply it consistently. You’ll spend far less time reacting to noise, and far more time positioned ahead of the moves that matter.
Comments are closed