


Where the “market is pricing a 68% chance of a cut” number comes from – and why it isn’t a forecast.
You’ve seen the headline a hundred times. “Markets are pricing a 68% probability of a cut at the September meeting.” It gets quoted on Bloomberg, repeated by every FX desk, and used to justify positioning in everything from the dollar index to the front end of the curve.
Almost nobody explains where the number comes from.
It isn’t a survey. It isn’t a poll of economists. Nobody at the central bank produces it. It’s a single number backed out of the overnight index swap market by an assumption you’d probably disagree with if anyone stated it out loud.
Once you understand the calculation (and it’s genuinely simple arithmetic) you stop reading these headlines as forecasts and start reading them as what they are: a translation of a market price into a format that fits in a headline. That shift matters enormously for how you trade FX, because the thing that moves currencies isn’t the probability. It’s the repricing of the underlying rate.
The short answer
Interest rate markets don’t trade probabilities. They trade rates.
What the market gives you is a single number: the average overnight interest rate expected to prevail over a specific future window. Compare that number to the current policy rate, and you get the market-implied expected change in policy – say, minus nine basis points.
A “probability” is then reverse-engineered from that expected change by assuming the central bank will do one of exactly two things: nothing, or a standard 25 basis point move. Under that assumption, an expected change of minus nine basis points implies a 36% chance of a cut.
That’s the whole trick. The expected rate is observable and real. The probability is an interpretation layered on top.
What an overnight index swap actually is
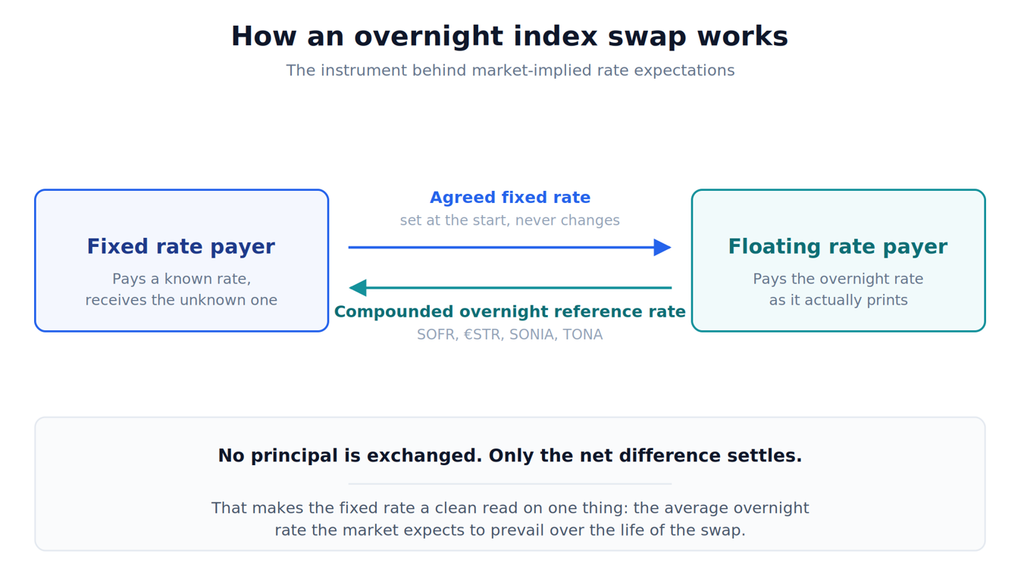
An overnight index swap (OIS) is an agreement between two parties to exchange interest payments over a set period. One side pays a fixed rate agreed at the outset. The other pays the compounded average of the central bank’s overnight reference rate over that same period.
Nobody exchanges principal. Only the difference in interest is settled at the end. That makes an OIS an unusually clean instrument – it carries almost no credit risk and almost no liquidity premium, so its price is close to a pure read on expected policy.
The fixed rate that makes the swap fair to both sides at inception is the market’s best collective estimate of what the overnight rate will average over that window. If you can buy or sell that rate freely, and the market is deep, then that fixed rate is the expectation, expressed in basis points.
The reference rate differs by currency:
| Currency | Overnight reference rate | Central bank |
| USD | SOFR (OIS) / EFFR (futures) | Federal Reserve |
| EUR | €STR | European Central Bank |
| GBP | SONIA | Bank of England |
| JPY | TONA | Bank of Japan |
| CHF | SARON | Swiss National Bank |
| CAD | CORRA | Bank of Canada |
| AUD | AONIA / cash rate futures | Reserve Bank of Australia |
| NZD | OCR-linked OIS | Reserve Bank of New Zealand |
The calculation that produces the headline
Here’s the version with clean numbers.
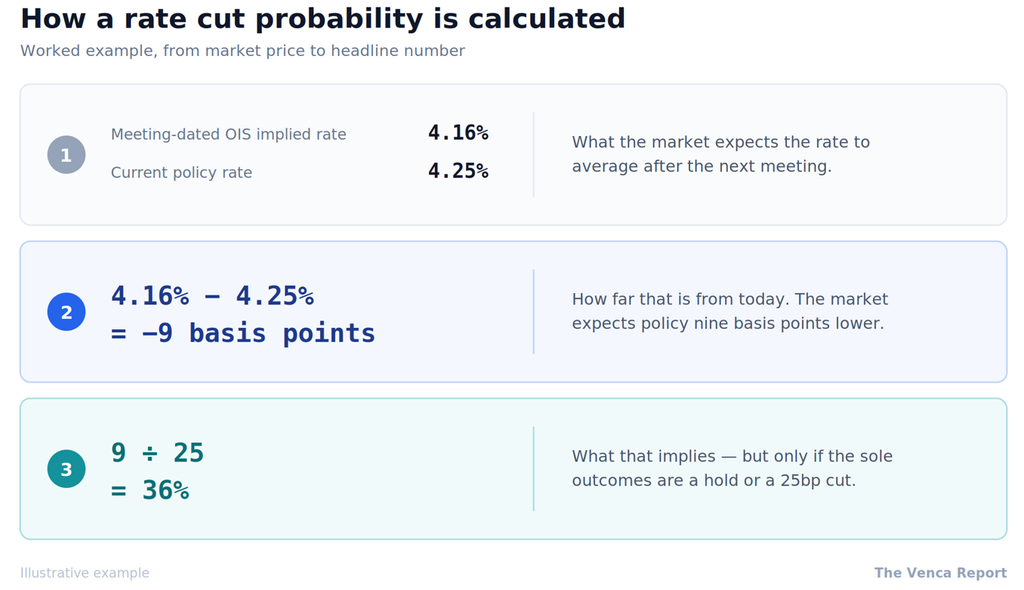
Assume the current policy rate is 4.25%. A meeting-dated OIS – one whose window begins the day the next decision takes effect and ends at the following meeting – is trading at an implied average overnight rate of 4.16%.
Step one: find the expected change.
4.16% – 4.25% = -0.09%, or -9 basis points
The market expects the policy rate to be nine basis points lower after the meeting than it is now.
Step two: convert to a probability.
Central banks move in 25 basis point increments almost all of the time. So assume only two outcomes are possible; hold, or cut 25bp.
Probability of a cut = 9 ÷ 25 = 36%
There’s your headline. “Markets price a 36% chance of a September cut.”
That’s it. No model, no volatility surface, no distributional assumptions. Just a division.
Why the US version looks more complicated
The most-quoted probabilities – the CME FedWatch numbers – don’t come from OIS at all. They come from 30-Day Federal Funds futures, which settle against the monthly average of the effective federal funds rate.
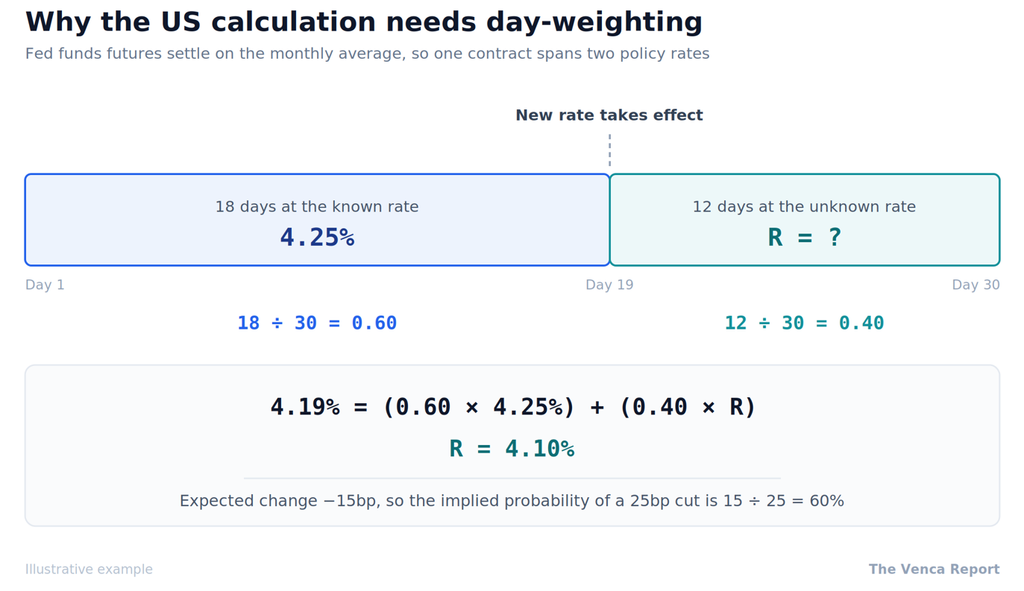
That creates a wrinkle. FOMC meetings rarely fall on the first of the month, so a single contract usually spans two different policy rates: the old one before the decision takes effect, and the new one afterward. You have to weight by days.
Take a 30-day contract month where the new rate takes effect on day 19. That’s 18 days at the old rate and 12 days at the new one. Current policy rate is 4.25%. The contract implies an average rate of 4.19%.
4.19 = (18 ÷ 30 × 4.25) + (12 ÷ 30 × R)
4.19 = 2.55 + 0.40R
R = 4.10%
Expected change: -15bp. Implied probability of a 25bp cut: 15 ÷ 25 = 60%.
Two practical notes. First, these futures are quoted as 100 minus the rate, so a price of 95.81 means an implied rate of 4.19%. Second, the Fed targets a range rather than a point, so the calculation anchors on where the effective rate actually prints inside that range – which is why FedWatch occasionally disagrees slightly with a back-of-envelope version.
The Australian equivalent works the same way. The ASX RBA Rate Tracker applies day-weighting to 30 Day Interbank Cash Rate Futures, and ASX publishes the formula openly.
The part almost everyone gets wrong
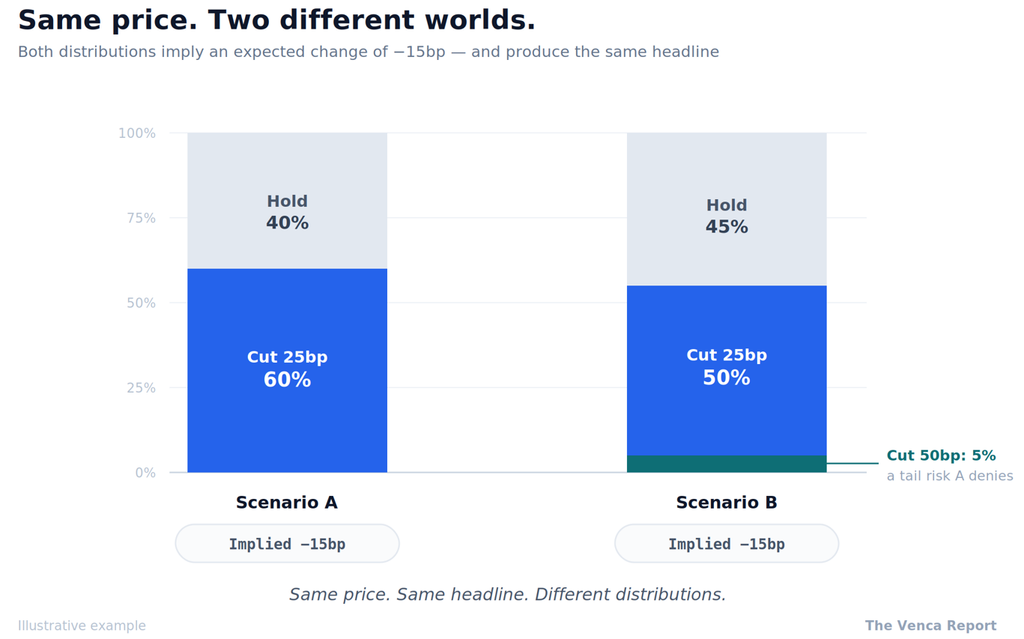
Go back to that 60% figure. It rests entirely on the assumption that the only two possible outcomes are a hold and a 25bp cut.
Drop that assumption and the same market price supports completely different stories:
- 60% chance of a 25bp cut, 40% hold → expected change -15bp
- 50% chance of a 25bp cut, 5% chance of a 50bp cut, 45% hold → expected change -15bp
Identical implied rate. Identical headline. Two materially different views of the world – and the second one contains a live tail risk that the first one denies exists.
This is why the probability is an output, not an observation. The market never told you it was 60%. The market told you it expects the rate to be fifteen basis points lower. Somebody else supplied the binary assumption that turned that into a percentage.
The practical consequence: watch the implied rate, not the probability. When a central bank is credibly considering a larger move, or an intermeeting move, the probability figure quietly becomes misleading while the implied rate stays honest.
Read the path, not the meeting
Fixating on the next decision wastes most of the information available to you.
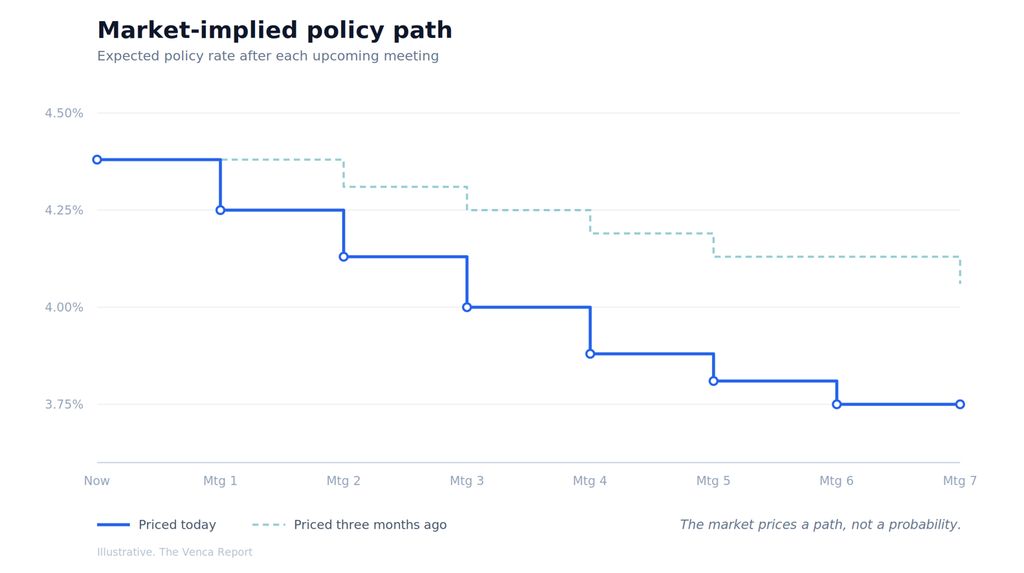
Meeting-dated OIS exists for every scheduled meeting on the calendar, which means you can extract an entire expected policy path – where the market thinks rates land in six months, twelve months, two years. For FX, that path is far more useful than any single meeting, because currencies discount the whole trajectory rather than the next 25 basis points.
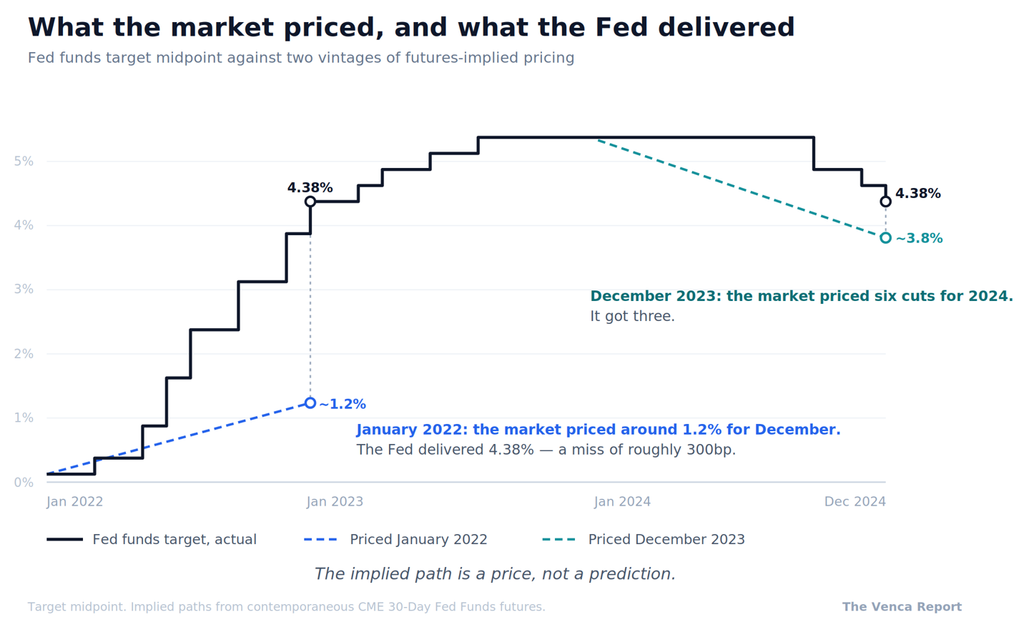
One important caveat as you extend out. At short horizons, OIS is close to a clean expectation. Further out, the rate embeds a term premium – compensation demanded for uncertainty about the path itself. So a curve implying 100bp of cuts over the next year is not the same as the market forecasting exactly four cuts. Part of that pricing is risk compensation, and the effect grows with horizon.
Treat pricing inside six months as roughly expectational. Treat anything beyond twelve months as expectation plus premium, and be careful about how confidently you describe it.
Where to find this data without a terminal
You don’t need a Bloomberg subscription for the basics:
- CME FedWatch – free, updated live, covers every scheduled FOMC meeting with a full probability breakdown by target range. The standard reference for US pricing.
- ASX RBA Rate Tracker – free, publishes both the implied yield curve and the calculation methodology for Australian cash rate expectations.
- Investing.com Fed Rate Monitor – a free alternative read on fed funds futures pricing.
- Central bank statements and minutes – free, and the necessary counterpart. Pricing tells you what the market expects; the statement tells you what the committee is actually reacting to.
- Sell-side strategy notes and wire commentary – for currencies without a public tracker, including NZD, market-implied pricing is usually quoted directly in bank research and newswire coverage.
For the smaller G10 currencies, public tools are thin. Bank strategists publish OIS-implied pricing for the RBNZ, Norges Bank and Riksbank regularly enough that you can track it from commentary, and short-dated interest rate futures serve as a workable proxy.
How to actually use this in FX
Here’s where most explainers stop and where the useful part begins.
The level of pricing is already in the price. If the market has fully priced a cut, the cut itself is not a trading event. Spot has already absorbed it. This is what “priced in” genuinely means, and it’s why currencies so often fail to move on decisions that seemed obviously bearish.
Changes in pricing are the tradable event. Currencies respond to repricing – the moment expectations shift. Which is why an inflation print or a jobs number frequently moves FX harder than the meeting it relates to. The data changes the path; the meeting merely confirms it.
What matters is the differential, not the absolute. A currency pair is a relative instrument. If the market prices 75bp of cuts for one central bank and 75bp for the other, the expected differential hasn’t moved at all, however dramatic each individual path looks. Build the comparison, not the single-country view. (Our piece on interest rate differentials covers the mechanism in depth.)
Asymmetry is the opportunity. When pricing is heavily skewed in one direction, the risk-reward for a surprise becomes lopsided. A currency where the market prices a near-certain cut has limited downside left from that cut and considerable upside if the central bank hesitates. This is also the setup behind most violent carry unwinds – see our analysis of the yen carry trade for how that dynamic plays out in practice.
Four mistakes worth avoiding
- Treating the probability as a forecast.
It’s a price. Prices are frequently wrong, and the market has been badly offside at nearly every major policy turning point. - Forgetting the 25bp assumption.
The moment a larger move enters the conversation, the headline probability stops describing the distribution accurately. - Comparing currencies without checking conventions.
Different reference rates, different compounding, different meeting calendars. Compare implied changes from each central bank’s own starting point, not raw rate levels. - Using long-dated pricing as pure expectation.
Term premium contaminates the signal as horizon extends. Say “the curve implies” rather than “the market forecasts.”
Frequently asked questions
What is an OIS-implied rate cut probability? It’s the market-implied chance of a rate cut, derived from overnight index swap or interest rate futures pricing. The market prices an expected average overnight rate; that figure is compared to the current policy rate and divided by 25 basis points to express it as a probability.
Is the probability produced by the central bank? No. Central banks publish no such number. It’s calculated by exchanges, data providers and analysts from tradable interest rate instruments.
How accurate are market-implied rate probabilities? They accurately reflect what the market is willing to pay at that moment, which is not the same as being right. Implied paths have been substantially wrong before every major policy pivot in recent history.
Why do currencies sometimes fall on a rate hike? Because the hike was already priced. If the market expected 50bp and received 25bp, that’s a dovish surprise regardless of the headline direction. Currencies trade the surprise, not the decision.
What does “fully priced” mean? That the implied rate has already moved the full 25 basis points, giving a probability at or near 100%. It means the market considers the outcome settled – and that positioning is likely already reflecting it.
The takeaway
The probability headline is a convenience, not a measurement. Underneath it sits a real, observable market price: the expected average overnight rate over a defined window.
Learn to read that price directly and three things follow. You stop being surprised when a currency ignores a decision everyone saw coming. You start noticing when the path – not the meeting – is what actually shifted. And you get considerably more careful about the word “forecast.”
The Venca Report tracks market-implied policy paths across the G10 alongside rate differentials and positioning in the members’ dashboard. Sign up for free market insights.
Comments are closed